Make the right decisions, faster.
Agentic analytics for e-commerce.
Know what's driving orders, margin and repeat buyers, and what to do next. Ask in plain language and get answers from your warehouse, with context that's always up to date.
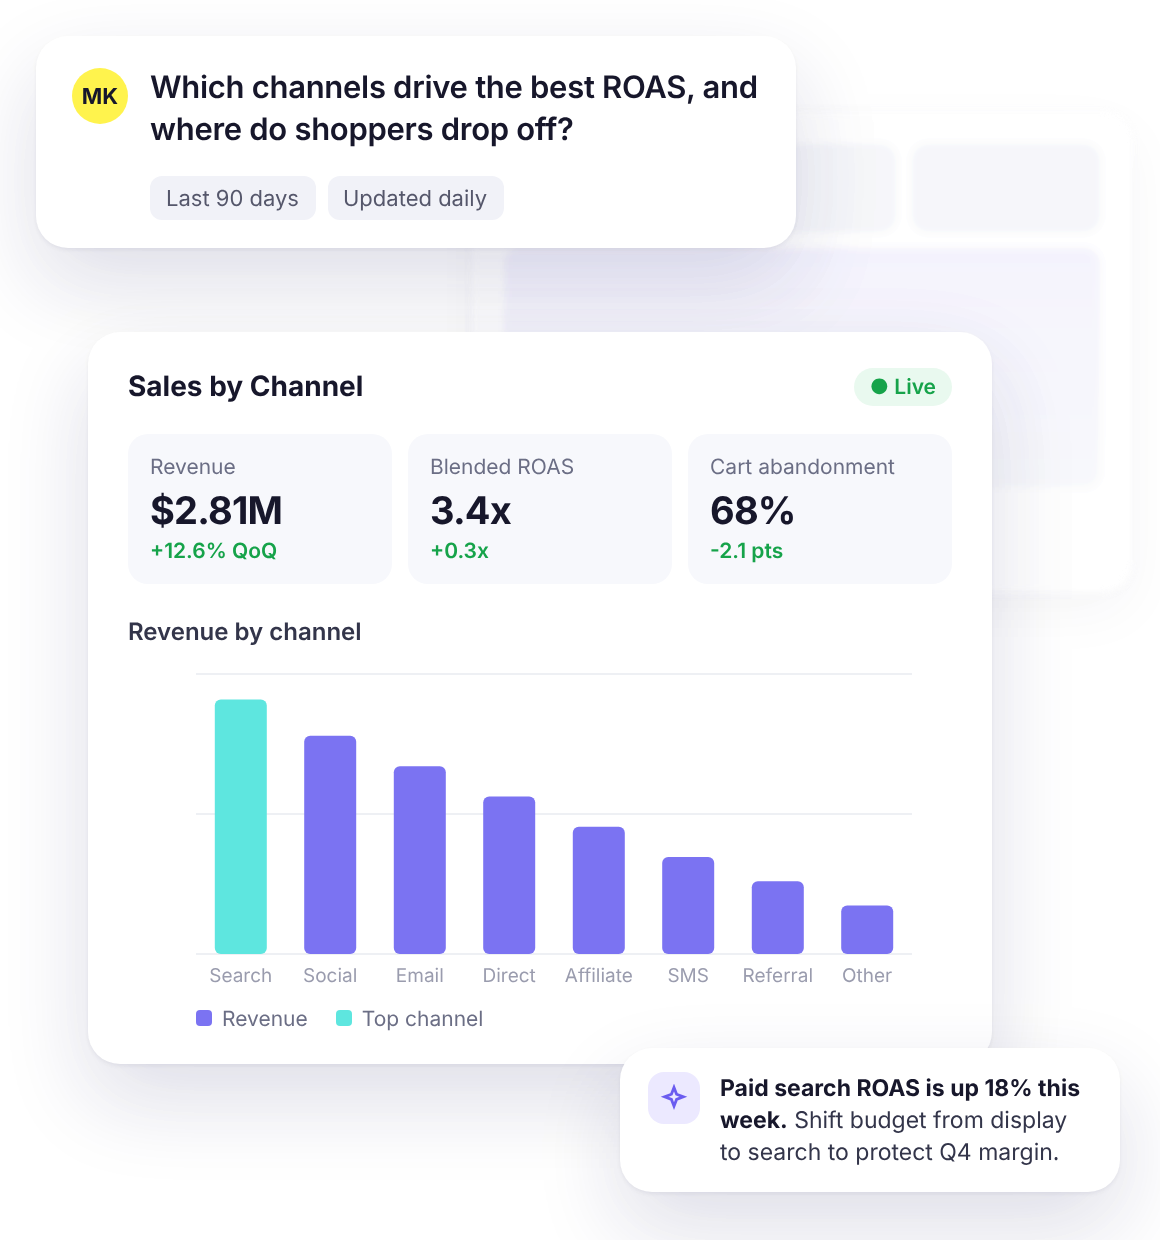
ClarityQ answering an e-commerce ROAS question with a sales by channel dashboard
ClarityQ reads your orders, sessions, ad spend and inventory the way a good commerce analyst does: guest and logged-in checkouts resolved to one customer, promo margin netted out, stockouts projected before they happen. Growth, merchandising and finance finally look at the same numbers.
‍
Ask in plain language. Get the answer, the chart, the SQL behind it and the action - a reorder, a promo change, a channel shift.

6⨯
Data team
productivity gain
3.6h
Saved per single ClarityQ session
1B+
Data rows covered by ClarityQ analyses
<7d
from connection to first trusted answer
ClarityQ answering an e-commerce ROAS question with a sales by channel dashboard
Built for E-commerce.
Made for Imperfect Data.
No ‘clean it first’. ClarityQ is built to work with your messy reality- automatically building & maintaining the semantic and contextual layers your data needs, while identifying, handling and cleaning data issues on the fly
No cleanup, no modeling required
Point ClarityQ at your raw warehouse. It infers schemas, resolves duplicates, handles nulls and conflicting field names - and learns your business naming on the fly.
One question. Every source.
Combine sales + finance, revenue + marketing spend, product + CRM in a single ask. ClarityQ joins across systems automatically. Undestand how to act and what to do with currency sinks, gacha rate drops, economy balance issues, level drop off and more
Asks back when it matters, proactively keeps the context in order
When there's ambiguity - duplicate metrics, overlapping definitions, missing periods - ClarityQ surfaces choices instead of guessing silently.
Start now with ClarityQWatch the ClarityQ demo video

The questions that come up every Monday in commerce

- answered without a SQL ticket.

Checkout conversion, second orders, CAC, promo incrementality, stockouts, returns. Pick one and see where a generic agent gets it wrong, and what ClarityQ does instead.
You ask:
“Why did checkout conversion drop for mobile traffic last week?”
Question icon
How it works
Why other agents break icon
Why other agents break
Other agents mis-join sessions to orders, count bot traffic, and can't separate a payment failure from a shopper leaving.
How ClarityQ resolves it icon
How ClarityQ resolves it
Aligns sessions by device and traffic source, filters bots and failed payments, and isolates exactly which step lost shoppers.
You ask:
“Which first-time buyers come back for a second order, and what did they buy first?”
Question icon
How it works
Why other agents break icon
Why other agents break
They can't bridge order history with the product catalog and customer identity across guest and logged-in checkouts.
How ClarityQ resolves it icon
How ClarityQ resolves it
Resolves customer identity across orders, groups by first-purchase category, and projects repeat curves by cohort.
You ask:
“Which channels deviate from our LTV forecast - creative or customer quality?”
Question icon
How it works
Why other agents break icon
Why other agents break
They fail to cross-reference ad platform spend, attribution and downstream order margin.
How ClarityQ resolves it icon
How ClarityQ resolves it
Reconciles channel aliases across platforms and splits variance into CAC shifts vs. post-purchase drop-off.
You ask:
“Did the 20% promo bring new customers or just discount the ones who would have bought anyway?”
Question icon
How it works
Why other agents break icon
Why other agents break
They report promo revenue and miss cannibalization, margin and the pull-forward from next month.
How ClarityQ resolves it icon
How ClarityQ resolves it
Compares promo buyers against matched non-promo cohorts, measures incremental orders and nets out the margin given away.
You ask:
“Which SKUs will stock out before the holiday peak at current sell-through?”
Question icon
How it works
Why other agents break icon
Why other agents break
They only report historical sales and can't project demand against inventory on hand and inbound.
How ClarityQ resolves it icon
How ClarityQ resolves it
Joins sell-through velocity with stock levels and lead times, projects stockout dates and flags reorders by priority.
You ask:
“Which products drive returns, and is it sizing, quality or expectations?”
Question icon
How it works
Why other agents break icon
Why other agents break
They can't connect return reasons to product attributes, reviews and the shopper's prior returns.
How ClarityQ resolves it icon
How ClarityQ resolves it
Links return reasons to SKU attributes and review text, and separates serial returners from product problems.
Quote icon
Guy Tomer, Co-founder and COO, CrazyLabs

ClarityQ has been a real game-changer for us! It lets our entire gaming team work with data at scale. We’re querying billions of events and dozens of tables, with in-depth analysis delivered in seconds. It empowers both analysts and game owners with 5× greater efficiency and real data superpowers - saving countless hours of analysis and enabling faster, better decisions.

CrazyLabs logo
Guy Tomer

Co-founder & COO, CrazyLabs

Quote icon
Avner Azulay, Zaffic


ClarityQ became a critical decision layer for us, turning complex behavioral data into clear actions. We identified friction points in our onboarding and loyalty mechanics, which led us to remove low-impact features and focus on real revenue growth.
‍

Zaffic logo
Avner Azulay

Director of Product, Zaffic

Quote icon
Eduardo, App Generation

ClarityQ lets our Marketing and Product teams get answers in minutes instead of hours. We used to juggle Firebase, GA, AdMob, Adjust - now everything lives in one place. Our analysis is easily 10x faster, saving us hours every time. But the real game-changer is the insights we wouldn't have found on our own - things we didn't even know to look for.

App Generation logo
Eduardo Carqueja

CEO, Appgeneration

Quote icon
Mark Shohat, Spiral Interactive


ClarityQ (or "Clara" as we refer to it) functions as a co-pilot analyst providing me and other stakeholders (including users who are resistant to use the standard reporting tools available in the company) with business insights via very friendly and convenient interface and visual outputs.

Spiral Interactive logo
Mark Shohat

Head of Business Analysis, Spiral Interactive

Quote icon
Marcos del Molino, Softonic


Thanks to the ClarityQ Agent and strong team support, we found the perfect analysis wingman. It has significantly sped up our deep-dive analyses, is expected to cut analysis time by at least half and has freed up time to focus more on strategic work.
‍

Softonic logo
Marcos del Molino

Data Analyst, Softonic

The E-commerce Analytics Agent
Sessions, Orders, Ads and Inventory in One Answer
Built for Your Data, Product and Business Teams
AI Agent.
Beyond Manual Barriers.
How it works
Transparent reasoning icon
Transparent reasoning, SQL and sources behind every answer
Validation engine icon
Built-in validation engine
Cross-dimensional analysis icon
Cross-dimensional analysis
Data, visualizations and insights icon
Data, visualizations, insights and action plans in one response
Dashboards and automated reports icon
NL-created dashboards and automated reports 
Governed and role-aware icon
Governed, collaborative and role-aware
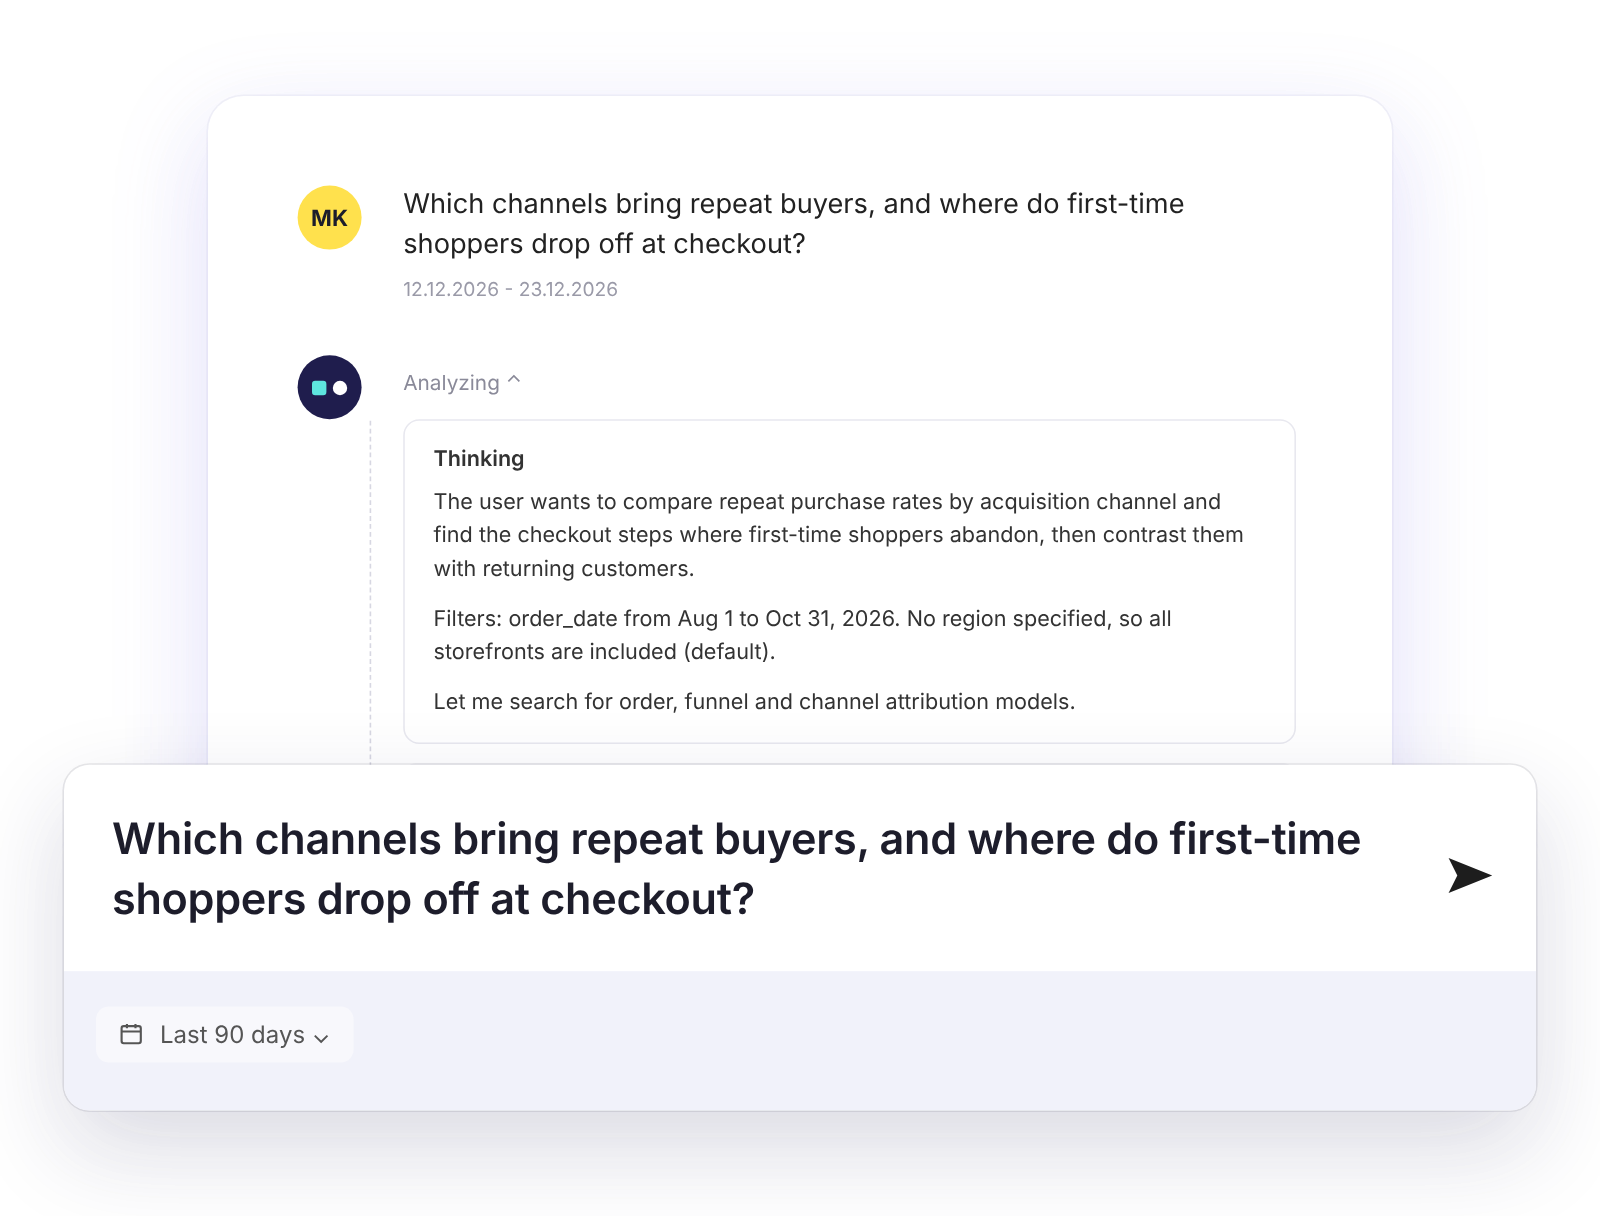
ClarityQ Ask Me Anything answering an e-commerce question with data, charts and SQL
Commerce workflows built in: promo incrementality, demand projection, cohort LTV
How it works
Transparent reasoning icon
Maps and understands tables, events, metrics, segments and entities across data sources
Validation engine icon
Dynamic, editable and version-controlled
Cross-dimensional analysis icon
Learns and adapts through Skills, Memory and Rules
Data, visualizations and insights icon
Human-in-the-loop validation when necessary
Dashboards and automated reports icon
Syncs with existing context layers
Context catalog
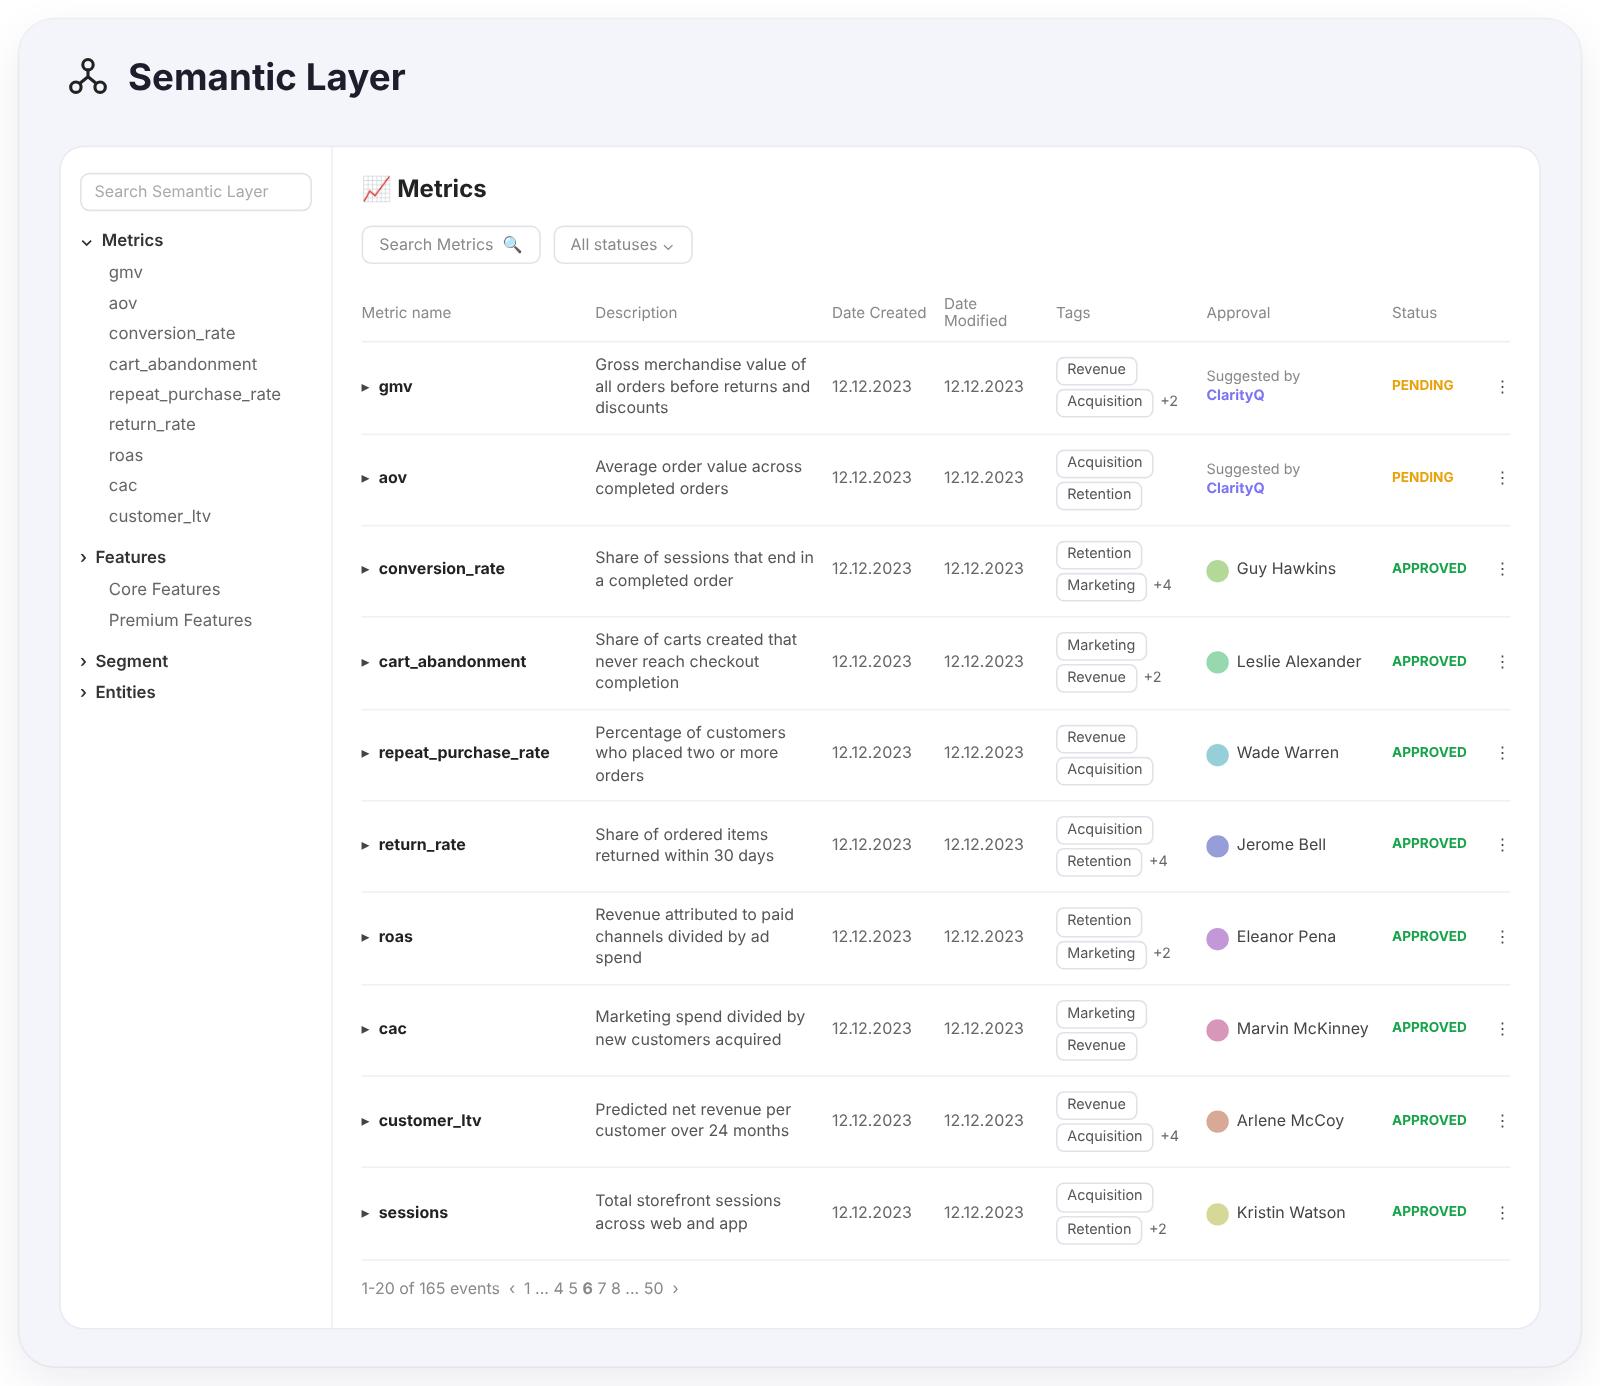
ClarityQ Context Layer with commerce workflows: promo incrementality, demand projection and cohort LTV
Instant Dashboards and Automations
How it works
Transparent reasoning icon
Generate full dashboards from a single prompt
Validation engine icon
Edit and query in natural language
Cross-dimensional analysis icon
Interactive, filterable and always up to date
Data, visualizations and insights icon
Share across teams with governed access
Dashboards and automated reports icon
Automated reports to your mailbox or Slack 
Dashboards
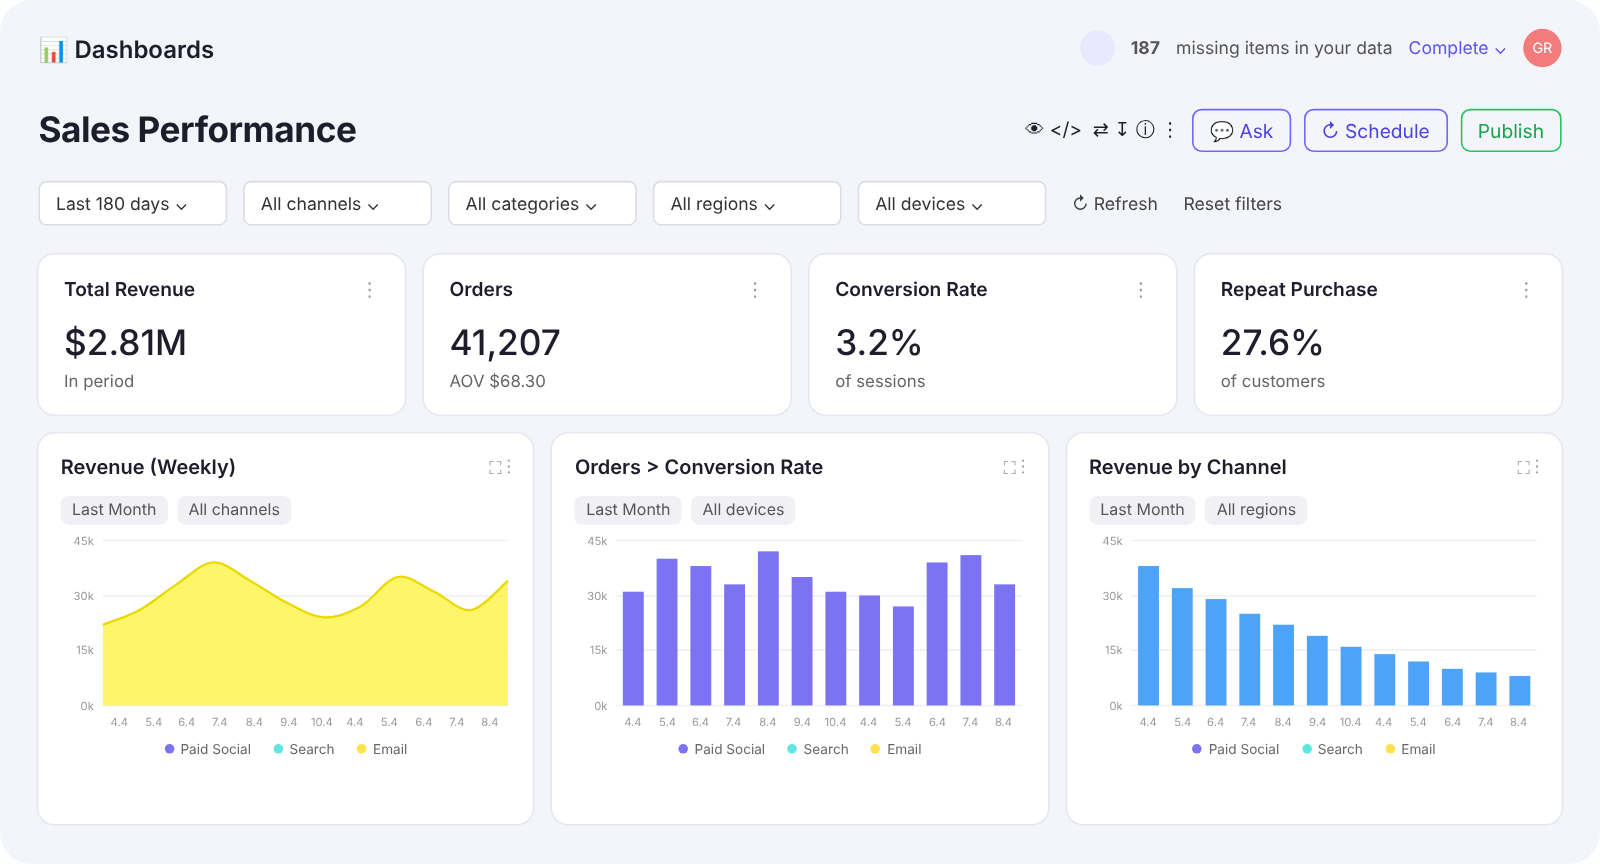
ClarityQ e-commerce dashboard generated from a single prompt

All-in Dynamic and Autonomous Semantics

Hierarchy icon
Order & Catalog Semantics
Understands orders, line items, variants, bundles and refunds - not just rows.
Cohorts icon
First-Purchase Cohorts
Groups customers by first order month, channel and category - then projects repeat and LTV curves.
Funnel icon
Funnel Intelligence
Understands browse-to-cart-to-checkout drop-off by device, source and landing page.
Segmentation icon
Customer Segmentation
Splits VIPs, repeat buyers and one-timers by behavior - not just spend.
Signals icon
Promo & Margin Signals
Measures incrementality, discount depth and contribution margin per campaign.
Revenue movements icon
Inventory Health
Tracks sell-through, stockouts and overstock against demand in real time.
Data integration icon
Ads + Orders Unified
Stitches ad platform spend with order and margin data for true blended CAC and ROAS.
Benchmark icon
Peak Season Readiness
Benchmarks KPIs against last year's peak and flags gaps before the rush.
Live in DAYS,
not quarters.
Connect your stack icon

Connect your stack

Warehouse, product analytics & BI tooling, read-only, in minutes.

Build the context layer icon

Build the context layer

ClarityQ understands your business context and catalogs metrics, segments and definitions.

Ask, decide, act icon

Ask, decide, act

Every team gets trusted answers, insights, and recommended actions.

Plugs into your warehouse and your BI 

Native connectors to every major cloud DWH and BI tool. Read-only by default.
Your data never leaves your perimeter.

Transparent reasoning icon
Read-only
Dashboards and automated reports icon
SOC 2 Type II
Validation engine icon
VPC / private link
Cross-dimensional analysis icon
Row-level security honored
Data, visualizations and insights icon

Data Warehouse

Snowflake logo
Snowflake
BigQuery logo
BigQuery
Redshift logo
Redshift
Databricks logo
Databricks
Postgres logo
Postgres
Amazon Athena logo
Amazon Athena
Azure Synapse Analytics logo
Azure Synapse
ClickHouse logo
ClickHouse

BI and Visualisation

Looker logo
Looker
Tableau logo
Tableau
Power BI logo
Power BI
ClarityQ logo
Metabase

Frequently Asked Questions

Which e-commerce metrics can ClarityQ answer questions about?

What data challenges does ClarityQ help solve?

What data sources does ClarityQ support and how does it integrate?

Is ClarityQ secure and compliant with data protection standards?

How is ClarityQ priced?

View all
Reach your data goals with ClarityQ

Ready to transform how you work with data?

Start Now