
.svg)
ClarityQ answers open-ended questions across any data, like where product meets finance, without compromising context or accuracy. It catalogs billions of tables, metrics, and events into a unified contextual layer in days, then delivers answers with visuals, insights, and a clear action plan.
Try ClarityQ on your data

ClarityQ has been a real game-changer for us! It lets our entire gaming team work with data at scale. We’re querying billions of events and dozens of tables, with in-depth analysis delivered in seconds. It empowers both analysts and game owners with 5× greater efficiency and real data superpowers - saving countless hours of analysis and enabling faster, better decisions.

Co-founder & COO, CrazyLabs


ClarityQ became a critical decision layer for us, turning complex behavioral data into clear actions. We identified friction points in our onboarding and loyalty mechanics, which led us to remove low-impact features and focus on real revenue growth.

Director of Product, Zaffic


ClarityQ lets our Marketing and Product teams get answers in minutes instead of hours. We used to juggle Firebase, GA, AdMob, Adjust - now everything lives in one place. Our analysis is easily 10x faster, saving us hours every time. But the real game-changer is the insights we wouldn't have found on our own - things we didn't even know to look for.

CEO, Appgeneration


ClarityQ (or "Clara" as we refer to it) functions as a co-pilot analyst providing me and other stakeholders (including users who are resistant to use the standard reporting tools available in the company) with business insights via very friendly and convenient interface and visual outputs.

Head of Business Analysis, Spiral Interactive

Thanks to the ClarityQ Agent and strong team support, we found the perfect analysis wingman. It has significantly sped up our deep-dive analyses, is expected to cut analysis time by at least half and has freed up time to focus more on strategic work.

Data Analyst, Softonic









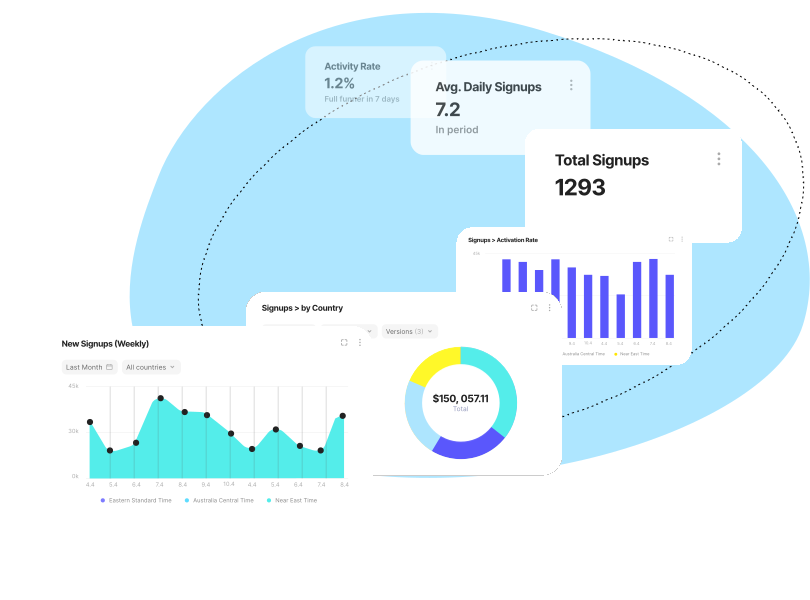
Stop translating business questions into BI tickets. Ask for the view you need - a retention overview, a revenue breakdown, a launch-day monitor - and ClarityQ assembles it as an interactive dashboard in seconds. Rearrange, drill in, and pivot between dimensions until it shows exactly what your team needs to act on.
A ClarityQ dashboard isn't a static wall of charts - it's a conversation. Every tile is a live entry point: click a spike, ask what caused it, and the agent runs the deep-dive right there, using the full analytical power behind the chart. Monitoring and investigation finally live in the same place.
Read more →Every dashboard is built on your governed Context Layer - the same definitions, metrics, and business logic your team has reviewed and approved. When a definition changes, your dashboards follow. No conflicting KPIs between teams, no mystery numbers, no hallucinated charts - just results you can trust, always.
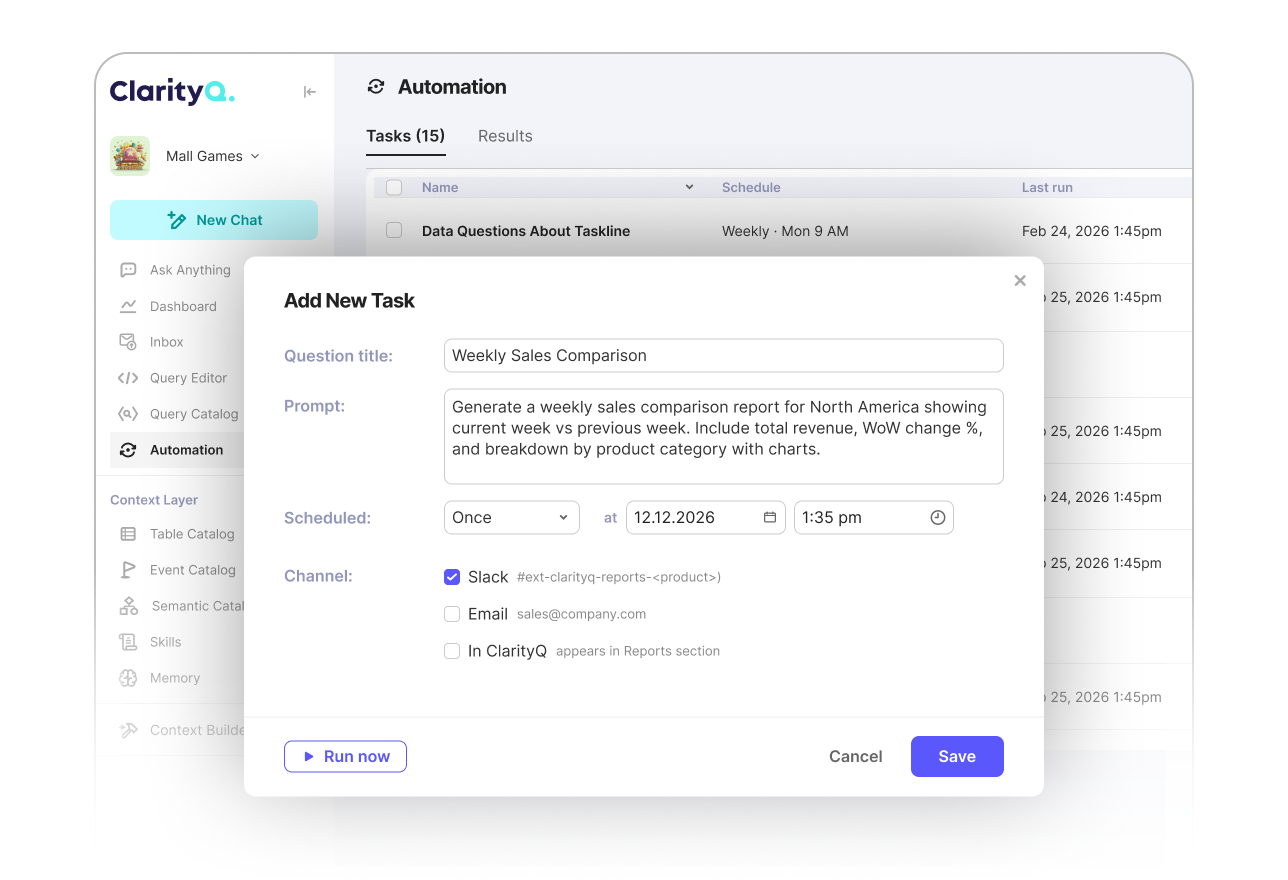
Set it once and let it run. Any dashboard can be delivered on a schedule - daily, weekly, or monthly - via email, Slack, or the dedicated Results tab. Fresh numbers reach your team automatically, so insights keep flowing even when you're not in the room.

Connect your data
Use a secure, guided wizard to connect ClarityQ to your data warehouse using a service account or your preferred auth method, and optionally connect BI tools and semantic layers
Read-only access to your warehouse
Additional integrations are optional and help enrich definitions and accelerate Context Layer readiness

Review and approve your Context Layer
ClarityQ generates business definitions, metrics, and contextual catalogs - you review, adjust, and approve what becomes your source of truth.

Start using ClarityQ
Start asking questions and get answers - make data-driven decisions faster than ever.