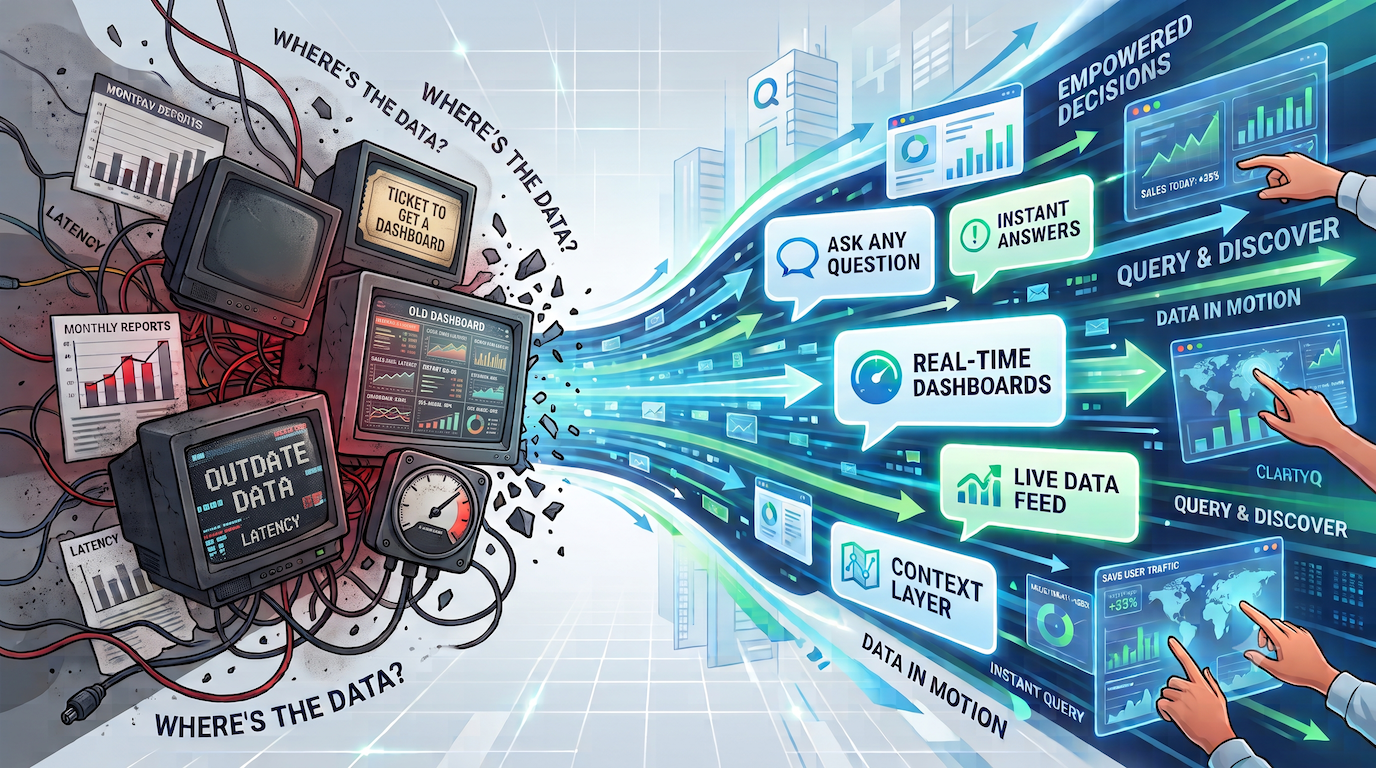
Do you still need dashboards now that AI can answer questions on demand? Mostly, no. Not the way you used them in the traditional BI era, anyway. When answers become cheap, dashboards should shrink to the four jobs they're uniquely good at: shared context, ongoing monitoring, recurring reviews, and directing AI investigation. Everything else should start as a conversation.
We recently launched AI-powered dashboards in ClarityQ. You can create them from a short prompt, modify them in natural language, ask questions about them, drill into anomalies, and even schedule AI investigations that continuously monitor them and surface insights. And because every dashboard is grounded in ClarityQ's Context Layer (the same shared definitions and logic that power everything else), the numbers you see are completely trustworthy.
But launching the feature got us thinking: what advice should we give customers who want to transition their old dashboards into the new era?
To answer that, it's worth looking at why dashboards became so central to analytics in the first place.
For about two decades, dashboards have been one of the most successful interfaces in business software. They solved a fundamental challenge: organizations had more data than people could process. Instead of digging through spreadsheets or waiting on analysts, teams could open a dashboard and immediately see:
Dashboards gave organizations something incredibly valuable: a shared view of reality. Sales, Marketing, Product, Finance, and Leadership could all look at the same metrics and discuss the same business. That was a huge improvement over what came before.
But over time, something happened. Dashboards got bigger and more complicated: filters, tabs, breakdowns, drill-downs. Entire organizations ended up managing thousands of them. The usual explanation is “more data.” We don't think that's really what happened.
Think about how analytics actually worked for the last decade. A VP asks a simple question: “Why did retention drop last month?” Getting an answer wasn't simple. You might have to find the right dashboard, ask an analyst, modify a report, add a visualization, validate the results, and wait for someone to investigate.
Answers were expensive.
Organizations adapted rationally: instead of building dashboards for today's question, they built for tomorrow's questions too. A dashboard that started as “How is retention performing?” quickly became: can we break it down by segment? Enterprise vs SMB? By country? By acquisition channel? Add cohort analysis? Include product usage?
The goal was never complexity. It was avoiding future work. If answers are slow, you try to anticipate the next question before it's asked. That's how so many dashboards turned into sprawling analytical Swiss Army knives, not built to answer one question, but to answer every question someone might ask next.
Once you see dashboards through this lens, a lot of familiar BI problems make sense.
Every stakeholder wanted their question included. A retention dashboard goes into review. Marketing wants acquisition channel. Sales wants Enterprise vs SMB split out. Customer Success wants ticket volume. Product wants feature adoption. Every request is reasonable, and since everyone knows changes later will cost time, there's strong incentive to cram everything in now. Soon the dashboard isn't about retention. It's about everything adjacent to retention.
Questions became dashboards. Someone asks how the launch performed, so we build a Launch Dashboard. Someone asks about enterprise behavior, so we build an Enterprise Dashboard. Over time, questions stopped being questions and became permanent artifacts. Years later, organizations are managing hundreds or thousands of them, each a question someone once cared about. Some still matter. Many don't. Very few ever get removed.
When in doubt, clone. Marketing wants a slightly different view of a Sales dashboard. In theory both teams could align on one version. In practice that meant negotiation, so the simpler path won: clone it. Now you have Sales Dashboard, Sales Dashboard Executive View, and Sales Dashboard Executive View Final. The problem was never technology. It was coordination: duplicating was easier than aligning.
The original question gets lost. A few years on, people still use a dashboard but nobody remembers why it was built. A QBR? A launch? A one-time executive request? The dashboard survives; the context disappears. Eventually the hard part isn't creating dashboards; it's finding the right one. Ironically, the tool built to make answers accessible turned finding the answer into a project of its own.
None of this happened because dashboards failed. They succeeded. These behaviors emerged because every workaround assumed one thing: getting a new answer would always be expensive.
That's the assumption AI changes.
For years dashboards carried an enormous burden (answer questions, support investigations, monitor performance, explain anomalies, and prepare for future questions), not because they were perfect for all of it, but because there was no practical alternative.
That alternative now exists. If a product manager wants to know why retention dropped last month, they don't necessarily need a dashboard. They need an answer. They can ask “Why did retention drop among enterprise customers in Europe?” and get a direct response, supporting visualizations, the segments and changes most worth investigating, and the ability to drill deeper through conversation, all in seconds.
Why can you rely on that answer? Because in ClarityQ it isn't improvised. Whether you ask in chat, generate a visualization, or build a dashboard, everything is grounded in the same organizational context layer: the same definitions, the same logic. That's the piece that makes “just ask” a serious option rather than a leap of faith.
When answers become cheap, many of the dashboards built to preserve those answers stop being necessary. Most questions are temporary. The answer is needed today, the visualization helps the conversation, and then everyone moves on. The dashboard never needed to exist.
That doesn't mean people stop wanting visualizations. We're visual thinkers: a chart can reveal in seconds what takes paragraphs to explain. The shift is that a visualization no longer has to become a permanent artifact. It can be generated for one question, used in one discussion, and discarded. The future isn't a world without charts. It's a world with far fewer permanent ones.
In the traditional BI era, the default response to a new analytical need was “let's build a dashboard.” In the AI era, the default can simply be “let's ask.”
If AI can answer questions, generate visualizations, and investigate anomalies, why have dashboards at all? Because they still solve real problems, just not the ones they solved in the traditional BI era. In the AI era, dashboards are for four things: shared context, ongoing monitoring, recurring reviews, and directing AI investigation. Here's how we think about using them, and the rules we'd follow.
Trust the Context Layer, Not the Dashboard. Whether you're asking a question in chat, generating a visualization, building a dashboard, or scheduling an AI investigation, everything is grounded in the same organizational context layer. The dashboard itself is not the source of truth; the context layer is. That means different teams using ClarityQ can create dashboards tailored to their needs without creating competing realities.
Don't build a dashboard until you need one. Dashboards used to be created in anticipation of future questions. Now you can just ask the question, explore, and investigate. Only build a dashboard if the question turns out to be important enough to deserve ongoing attention. A good test: will I still care about this next month? If not, generate the visualization, have the discussion, and move on.
Reserve dashboards for shared context and recurring work. This is what dashboards are genuinely best at.
In those settings the dashboard isn't the answer; it's the agenda. A consistent frame for the discussion.
Use dashboards to monitor what matters, for humans and for AI. Some metrics deserve continuous attention: revenue, retention, pipeline, reliability. Some dashboards exist precisely because monitoring is the job: audited financial and regulatory reporting that has to stay consistent and defensible, or real-time operational monitoring where an on-call team watches uptime, latency, and error rates to catch problems the moment they surface. A dashboard gives you that at-a-glance view.
But there's a new role here that didn't really exist before. When you build a dashboard, you're implicitly saying these are the metrics we care about, these are the signals worth watching. AI can use that. It's why we built the ability to schedule AI tasks directly from a dashboard: ClarityQ can continuously monitor it, detect anomalies, investigate changes, and surface insights proactively. The dashboard becomes a monitoring specification: a way of directing attention, human and artificial.
Let dashboards start investigations, not end them. Historically the dashboard was the destination: you opened it hoping it held the answer. We think they work better as starting points. Activation drops. An anomaly appears. An AI insight lands. A question forms. Then the real work begins, through conversation, follow-up questions, generated visualizations, AI analysis. The dashboard provides the context. The analysis happens afterward.
Make personal dashboards. This wasn't practical in the old world, where building a dashboard meant analysts and BI teams, so dashboards had to serve large audiences. Now anyone can build a reliable one in seconds. Build them for your product area, your customers, your KPIs, your weekly workflow. They don't need to be shared with the whole company. Sometimes the best dashboard is the one built specifically for you.
Delete aggressively. This may sound strange coming from a company that just launched dashboards, but we believe it strongly. Dashboards accumulate faster than their value. If nobody looks at it, if it's no longer helping anyone decide anything, if the original question stopped mattering, remove it. Now that creating a dashboard is cheap, keeping old ones around “just in case” matters far less than it used to.
When teams move to ClarityQ, the instinct is “let's recreate everything.” We'd encourage you to resist it. The constraints that produced all those dashboards no longer exist, so recreating them just rebuilds twenty years of habits on new infrastructure.
Instead of asking which dashboards should we migrate?, ask which dashboards still deserve to exist? Run each one through three buckets (keep, convert, or retire), with one rule for whatever survives:
Keep the dashboards that provide ongoing value: shared context, recurring reviews, ongoing monitoring, AI-driven investigation. These are your migration candidates.
And whatever you keep, simplify heavily. Don't copy a dashboard just because it was complicated in Tableau or Power BI. Those sprawling, filter-and-tab-heavy dashboards were built to be the place investigation happened, but that's no longer the dashboard's job. If you find yourself rebuilding an AI dashboard with dozens of filters and breakdowns, that's a sign you're doing it wrong. Keep the core metrics and a few basic filters, and let the AI investigate the dimensions: the segments, the cohorts, the drill-downs. The dashboard surfaces what matters; the agent does the digging.
Convert to conversation the ones that exist only because someone once needed answers to a specific set of questions. In ClarityQ those questions can be asked directly. The dashboard disappears; the questions remain. If a complicated dashboard was built for deep analysis, for example, convert it to a simple dashboard and let the AI do the deep analysis for you.
Retire the rest: the ones solving problems that no longer exist, rarely viewed, or replaced by newer workflows. Most teams are surprised how many fall here. In our experience, teams that migrate to ClarityQ retire more than 60% of their dashboards. The move is a chance to clean house. If no one opened a dashboard in the past month, or if no one is really sure why a dashboard was built in the first place, deprecate it.
The goal isn't to recreate your traditional BI environment. It's to end up with a smaller, cleaner, more intentional set of dashboards than you have today.
If we were starting from scratch today, we'd aim for dramatically fewer dashboards than most organizations have, but we'd make each one far more intentional: shared context, ongoing monitoring, recurring workflows, AI-driven investigation. Everything else would start with a conversation.
That's the opportunity we think AI actually creates. Not a world with more dashboards. A world where dashboards finally get to focus on the few things they're uniquely good at.
Want to see what that looks like in practice? Create your first AI dashboard in ClarityQ from a single prompt, then ask it the question you'd normally have built three dashboards to answer.
Are dashboards dead? No. Dashboards are no longer the default way to answer analytical questions, but they remain the best tool for shared context, continuous monitoring, recurring reviews, and directing AI investigation.
When should you still build a dashboard? Only when a question deserves ongoing attention: a metric you'll still care about next month, a recurring review, or something you want AI to monitor continuously. For one-off questions, just ask.
Should you migrate all your Tableau or Power BI dashboards to an AI analytics platform? No. Sort them into three buckets: keep (and simplify) the ones that provide ongoing value, convert one-off question dashboards into conversations, and retire the rest. Most teams retire more than they expect.
Can you trust AI-generated answers as much as a dashboard? Yes, if they're grounded in a Context Layer. In ClarityQ, chat answers, generated visualizations, and dashboards all draw on the same definitions and logic, so there is one source of truth regardless of interface.