
Mobile attribution runs on modeled, aggregated signals now, not clean device-level matching. Apple and Google have been dismantling the 1:1 data pipeline for years for user privacy. That is not new. It gets more severe every quarter.
iOS runs two attribution frameworks in parallel: Apple's AdAttributionKit (AAK) alongside SKAdNetwork (SKAN), each with its own postback format and timers. Android took a different route. Google retired most of the Privacy Sandbox APIs in October 2025 and says the advertising ID stays for at least two more years, so the direction of travel is the same but the runway is longer.
This is brutal for gaming specifically. As Josh Chandley put it in a recent Deconstructor of Fun guest post: "Two users with the same d28 ARPU are valued by networks equally, even if one has already churned."
Because postbacks are delayed and aggregated, you cannot cleanly map early network data to long-term LTV without heavily modeled pipelines.
The old way. Every device had a unique ID tag (IDFA, Android ID). A player clicked an ad, installed, spent $50 two weeks later, and your servers matched that ID back to the ad. You knew with near-certainty which campaign generated every dollar.
The new reality. Apple did not delete the IDFA, it put it behind a permission prompt, and only about a quarter to a third of users say yes. For everyone else the platform systems hold the data, strip out the identities, and send back delayed, anonymous batches. Instead of "Player #4829 clicked Ad B and spent $50 on Day 14," your studio gets "Ad B brought in roughly 20 installs yesterday, and at least one of them bought something."
Where the MMPs come in. AppsFlyer, Adjust, Singular and the other MMPs have done a lot of heavy lifting to keep attribution usable post-ATT. They collect the SKAN and AAK postbacks, dedupe them against their own modeled attribution, and give you one coherent view of who came from where. That view is the attribution source of record, and everything below treats it as the input, not a replacement.
But, what the MMP does not see is what happens after the install. The sessions, the progression, the economy events, the repeat purchases, everything the player actually does inside your game. That first-party behavior is the other half of the picture. The MMP owns attribution. An analytics layer works on top of it and joins the two, so "who came from where" finally meets "and what were they worth 60 days later."
Unlike most industries, games monetize over weeks or months. Privacy frameworks stop reporting on a cohort within days. SKAN 4's final window closes at day 35, and most of the signal arrives far earlier. So the platform signal alone cannot tell you whether the players it attributed turned into profitable long-term spenders.
When D30 revenue suddenly drops for a group of players, it is hard to say who is at fault. A UA channel? A new build? Both? The trail connecting the ad to the gameplay has been cut.
Experiments do not fully fix it. They are slow, and they cannot solve the intersection. You cannot cleanly put "only the users from this new UA channel" into a product A/B test, because you cannot isolate that cohort in real time. This is a mobile problem, incidentally. On Steam, consoles and D2C web shops you still control the cohort.
Iaroslav Kobozev, Head of Marketing Analytics at AppQuantum, puts it plainly: "The most frustrating part is that these issues are easily avoidable if proper tagging and aggregation are implemented from the start." Get your first-party tagging right on day one. Everything else here depends on it.
Here is what happens when a BI team wires the raw platform feeds into the warehouse side by side instead of working from the MMP's deduped view.
A high-value player makes a $99 in-app purchase. Your warehouse receives a delayed coarse-value postback from SKAN, a separate re-engagement signal from AAK, and the ad network's own reported conversion. All three streams claim the same transaction.
Hard-code these pipelines together with rules-based SQL and you get double-counted revenue. UA scales budgets on a 120% ROAS while Product and Finance watch actual server revenue stay flat.
This is exactly the problem MMPs solve. Use your MMP's deduped view as the source of truth for attribution, then move on to the harder problem: the one attribution was never designed to answer.
Three layers, each with a job.
Networks report what they can see: short windows, their own credit.
MMPs collect, dedupe and model the fragmented signals into one attribution view. Hard problem, done well. Without it there is nothing to calibrate.
The translation layer sits on top and connects the MMP's attribution view to your server-side economy: cohort D60 revenue, the LiveOps calendar, releases. It answers a different question than attribution. Not "where did this install come from" but "did this spend grow the business."
Leading studios have stopped trying to force a 1:1 ID match onto shiny dashboards. Instead of obsessing over individual attribution, they measure top-down incrementality: does total spend move total revenue, and over what horizon?
As Chandley writes in the same Deconstructor of Fun piece:
"Networks optimize for short-horizon proxy metrics because that's what they can observe reliably. Publishers optimize for long-horizon yield because that's what actually pays the bills. And no single party owns the translation between the two."
So studios are pulling it in-house: server-side Media Mix Modeling blended with geo-holdout tests, fed by MMP attribution data, to verify whether short-term spend actually lifts the global economy long-term.
A geo-holdout is the definitive way to test whether a network's spend is actually growing your revenue, or whether it is landing on players who were going to install anyway. The network cannot answer this for you, and not for want of trying: from where it sits, an install it caused and an install it merely witnessed look the same. You set the network dashboard aside and look only at your own game server. Your MMP likely offers incrementality or geo-lift tooling for this. Use it if you have it, the logic is the same.
Your UA team spends $50,000 a week on an iOS campaign via network X. The dashboard reports a 120% Day-3 ROAS.
Instead of taking it at face value, split a market. Pick two regions with historically similar in-game revenue behavior, say Texas and Florida.
A two-week holdout measures short-term lift, and that is fine. It is the calibration point. The long horizon is step 2's job.
Geo-holdouts give you the truth, but they are slow and expensive. You cannot run one for every campaign every week. This is where Media Mix Modeling earns its place.
MMM is a statistical model that sits on your server. Instead of matching a click to a user, it looks at macro inputs against macro outputs and answers the top-down question: on days when we increase global spend by 10%, does global Day-60 LTV go up?
The model takes total daily spend per channel and regresses it against total game revenue. Two things make it work for gaming.
First, adstock. Ad spend keeps working for days after it is spent, so the model applies a decay curve per channel based on that channel's history.
Second, cohorts, not daily cash. A generic MMM regresses spend on same-day revenue, which is useless when your revenue arrives over 60 days. A gaming MMM regresses spend against cohort maturity. Privacy rules hide which ad a player clicked, but your server knows exactly how many players joined on January 1st and exactly how much that cohort had spent by March 1st.
One more gaming-specific trick: advanced MMMs factor in product variables. The model knows you launched a Double Gem Weekend or a major update. If UA scales a campaign on Friday and Product launches the event the same Friday, global revenue spikes. A naive UA dashboard takes 100% of the credit. The MMM sees the whole picture and isolates how much came from the ads and how much from LiveOps.
The geo-holdout provides the calibration. The MMM provides the scale.
When your Texas/Florida holdout proves that channel X's "120% ROAS" is actually a 20% incremental lift, you feed that back into the MMM. The model now discounts that channel's short-term claims automatically. It translates the network's short-horizon signal into long-term server reality.
Put adstock and cohort data together and the model starts finding patterns like this one (illustrative): whenever X channel spend increases by 20% on a Monday, Day-60 LTV of that cohort reliably rises by 8% two months later, even after subtracting the impact of the new game update.
The model does not need to stalk an individual player for 60 days to prove attribution. It uses history to show that spend at the top of the funnel reliably creates a predictable wave of delayed revenue.
That is how studios confidently scale budgets today. Not by tracking devices, but by mathematically linking today's spend to tomorrow's economic wave.
Everything above is the theory. Here is the actual audit, in four blocks: what the network says, what your server says, the two adjustments games specifically need, and the output.
Block A: network claims. What the ad network dashboard says.
Block B: first-party ground truth. What your own server database says, and what management ultimately judges you on.
Block C: the gaming adjustments. This is the part a generic incrementality template does not have, and it is the part that protects Product's credit.
Block D: the output. All auto-calculated.
Expected baseline revenue = trailing avg/day × 7 × (1 + organic drift rate)
True incremental revenue = (actual server revenue − expected baseline) − LiveOps contamination
True iROAS = true incremental revenue ÷ total ad spend
Incrementality gap = (network-reported revenue − true incremental revenue) ÷ network-reported revenue
The incrementality gap is the share of the network's claim that is not backed by movement in your own server data. Read it like this:
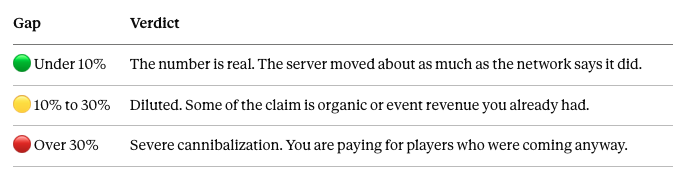
One thing to be careful about here, because it is the most common way this framework gets misread: a green gap does not mean the campaign is profitable. It means the reporting is honest. A small, accurate claim can sit on top of a small, unprofitable lift. So score the second question separately, against your own break-even iROAS, which is 100% if you are working in gross revenue and higher if you count net after store fees or need margin on top.
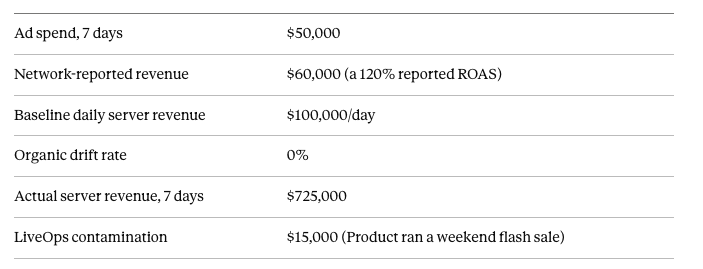
Your growth team launches an aggressive campaign on channel X on a Thursday. Over the next seven days the network dashboard looks phenomenal, and on that evidence doubling the budget is the right call. Then someone runs the numbers.
The inputs:
The output:
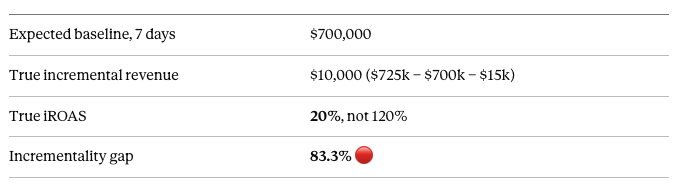
The verdict: the campaign reached players who were going to install and buy during the flash sale anyway. Without the audit, UA would have doubled down on a campaign returning 20 cents on the dollar, and the flash sale would have taken the blame six weeks later when the numbers did not hold up.
Notice how little of that is visible from either side on its own. The network is not lying, it is reporting what it can see. The server is not wrong, it just does not know which revenue came from where. The answer only exists where the two meet.
Worth being honest about the labor, because it is the reason most teams do this once and then stop.
To run this manually and get everyone to agree on the result, your data team has to execute a cross-warehouse SQL join, adjust for Product's live event flags, and account for SKAN timer decay. Per channel launch. Per budget shift. Realistically about 45 minutes per audit, and that is before anyone argues about the LiveOps number.
Which is fine once. It is not fine as a standing weekly discipline across every channel, which is what it needs to be to actually change decisions.
With an analytics agent, the same audit is a question:
"Calculate the true iROAS for the X channel iOS campaign, stripping out the revenue lift from the Double Gem Weekend event."
Give it your LiveOps calendar and it queries the siloed data, runs the math and hands back the verdict. Then ask it to run the same analysis every week, post the result to Slack or email, and alert you when the gap moves.
Run by hand, a holdout and an MMM refresh take weeks of skilled work, and they only cover the channel someone had time to look at. That is not a failing of the people doing it. It is that the method runs slower than the media buying it is meant to govern, so spend keeps moving while the answer is still being built.
Instead of a passive BI dashboard where an analyst pulls the report, spots the discrepancy and writes a ticket, agentic analytics adds a layer that can sense, reason and act on the data streams.
Passive BI: the dashboard shows the network's reported 120% ROAS. Nothing on that screen can tell you whether the revenue was incremental, so the budget scales. Weeks later a holdout shows server revenue never moved, and by then the spend is gone.
Agentic analytics: you give the agent a persistent goal, tracking and alerting on actual incremental revenue. It continuously ingests the MMP and network APIs, cross-references them against the live server baseline, and applies the MMM rules in the background.
It does not just visualize. It runs a multi-step reasoning workflow. If the network claims a spike and the global economy has not budged, the agent flags the discrepancy, shows its work, and, if you let it, pauses the campaign. The rigor of data science at the speed of media buying, with a human still holding the budget.
The ship has sailed on 1:1 attribution, and that is fine. Technology has caught up. A translation layer that sits on top of your MMP data and your own server revenue can close the short-term / long-term blind spot. The gap is not in the tooling any more. It is in whether your team has wired it together.
Everything in the four blocks above, as a calculator. Type in the six numbers and your break-even, and it returns the expected baseline, the true incremental revenue, the true iROAS, the incrementality gap, your incremental profit in dollars, and both verdicts.
One honest caveat: it compares actual server revenue to your baseline, so it measures the total lift of whatever changed in the window. It is built for a single new channel launch, a big budget shift, or an audit of total paid spend. It will not untangle ten simultaneous campaigns. That is the MMM's job.